|
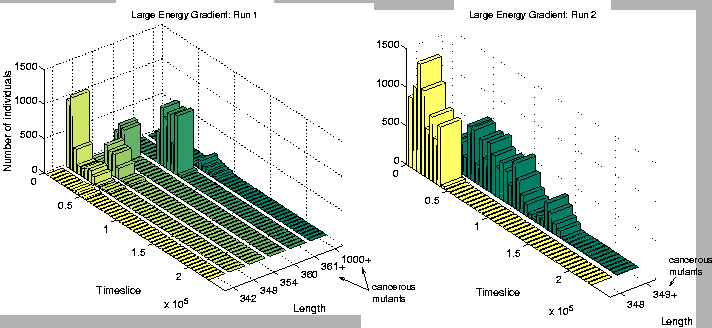
A closer analysis of the two runs (numbers 1 and 2) where the population suffered extinction revealed that both had succumbed to a cancerous mutation early on in the run. The rise and fall of genotypes of different lengths in these runs in shown in Figure 6.19. In both runs, virtually all non-cancerous programs had disappeared within the first 50,000 time slices, and the whole population had become extinct by time slice 100,000 in Run 1, and time slice 200,000 in Run 2.

|
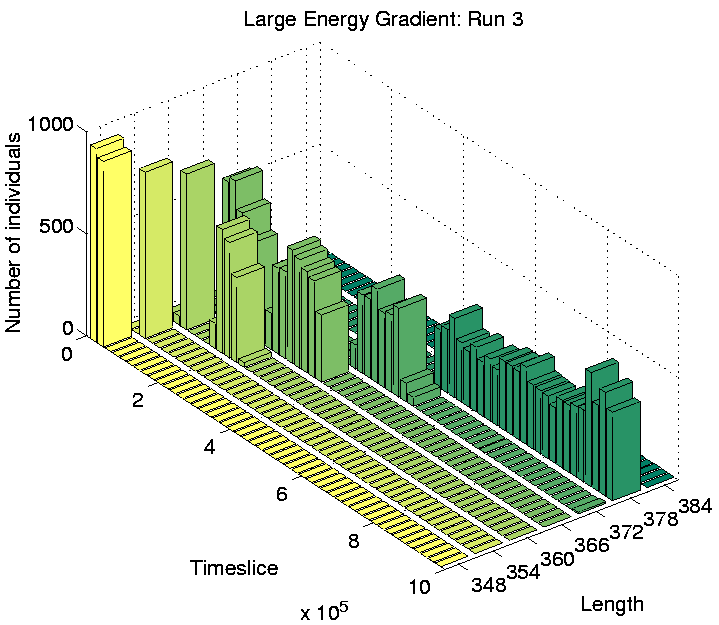
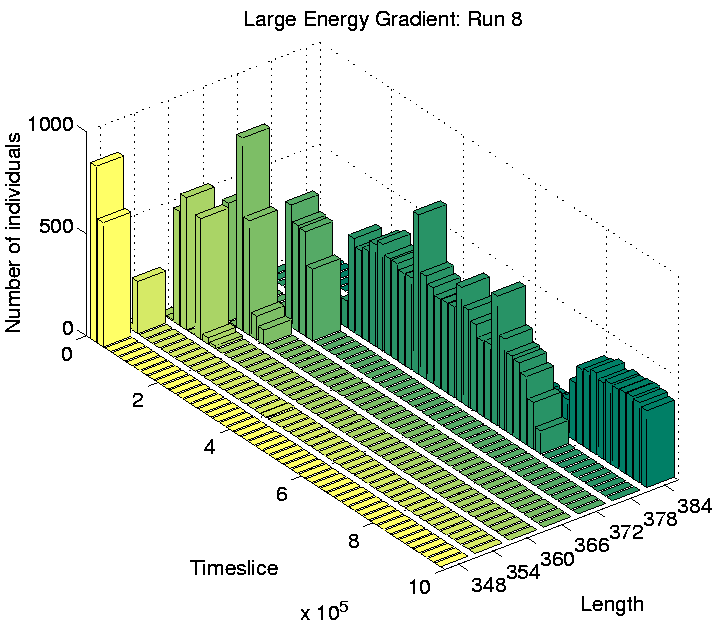
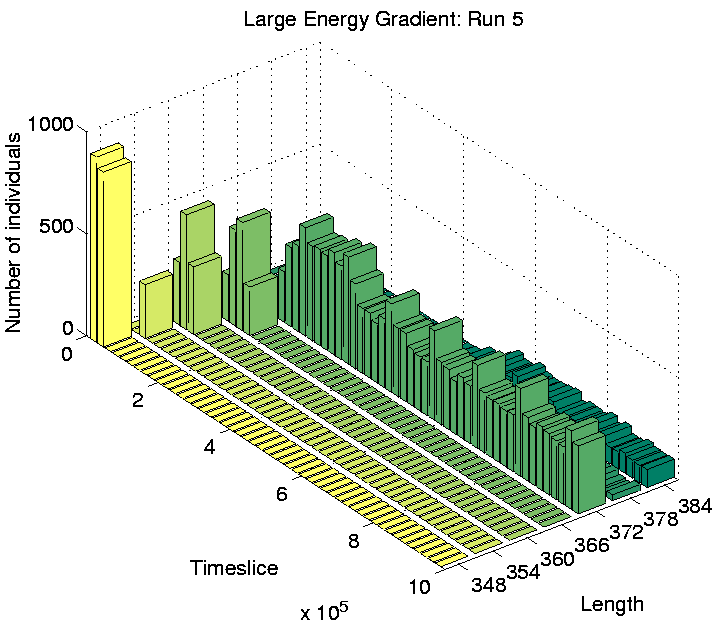
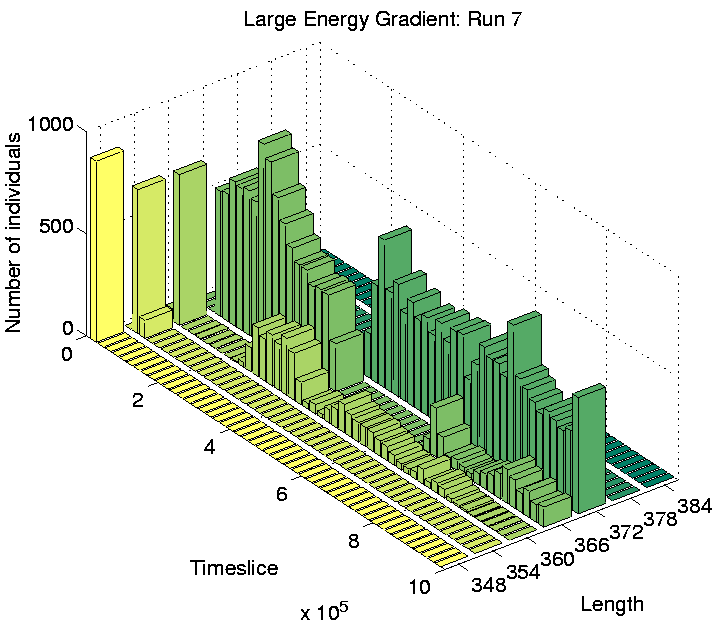
Investigation of the Class 2 runs revealed some interesting results. In two of them (Runs 3 and 8), the population was dominated by programs of a single length at the end of the run. However, in the other two (Runs 5 and 7), there were significant numbers of programs of more than one size: the end-of-run population in Run 5 contained programs of lengths 372, 378 and 384 bits; while the end-of-run population in Run 7 contained programs of lengths 366 and 372 bits. The change in the constitution of the populations of all four of these runs is shown graphically in Figure 6.20.
|
These graphs further reveal that the population in Runs 3 and 8 tended to be composed of programs of a single dominant length at any point during the run. In contrast, the population in Runs 5 and 7 comprised programs of two or more different lengths for most of the duration of the run. This is the first experiment in which programs of different lengths have been observed to coexist for prolonged periods, at least while the system is in a Class 2 state.
In order to see whether these programs of different lengths were inhabiting different areas of the environment, graphs of spatial distributions were plotted for these four Class 2 runs.
For Runs 3 and 8, which contained programs of a single length only, the distributions are shown in Figures 6.21 and 6.22. This figures show that programs are occupying positions in the rightmost three-quarters of the grid. The reason why the leftmost quarter appears to be inhospitable can be understood by looking at the `equilibrium' environmental energy distribution, plotted in Figure 6.23. This graph is plotted from data extracted from an output file, and shows how much energy is normally available in grid positions along the x-axis (i.e. along the energy gradient). For each position, this is the amount of energy which it will have in store if it has not been drained by programs in the recent past. The graph shows that positions in the leftmost quarter of the grid typically have fewer than 10 energy tokens available at any given time. Now, the ancestor program was designed on the assumption that each et_collect instruction would collect 10 energy tokens; if it regularly collects fewer than 10, it will eventually starve. The leftmost quarter of the grid in these experiments therefore contains insufficient energy for the ancestor programs to survive. The fact that no programs occupied these positions even towards the end of Runs 3 and 8 (and, as we will see, this is also true for all of the other runs) suggests that no programs evolved the ability to collect more energy from the environment and thus be able to survive in this region.
 |
 |
The shape of the graph in Figure 6.23 needs a little more explanation. The energy gradient on the left half of the grid is exactly as expected, and reflects the amount of energy distributed to those positions at each pass through the Cosmos control loop. The levels on the right half of the grid are somewhat unexpected. In these experiments, the parameter max_energy_tokens_per_grid_pos was set to its default value of 100, and all positions on the right half of the grid store this maximum amount of energy (in the absence of programs to drain it). This turns out to be due to a feature of the AttenuateEnvironmentalEnergy routine, which is executed at the end of each pass through the main control loop (see Section 4.7). After all programs have had a chance to execute some instructions, this routine removes a certain amount of energy from each grid position in order to prevent it from building up excessively. The current implementation of this routine works by subtracting an amount determined by the parameter number_of_energy_tokens_per_grid_pos_per_sweep from each position. (The default value of this parameter, as used in the current experiments, is 30.) When energy is distributed evenly across the environment, this means that each position loses the same amount at the end of each iteration of the control loop as it is given at the beginning of the loop. However, in the current case, positions in the right half of the grid are given more than 30 energy tokens per iteration. They are therefore able to accumulate these tokens over time, and soon reach the maximum level allowed. This feature of the energy distribution turns out to have important consequences for the results of the other runs, as will now be explained.
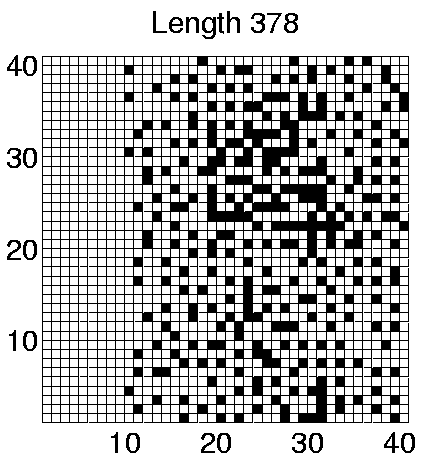
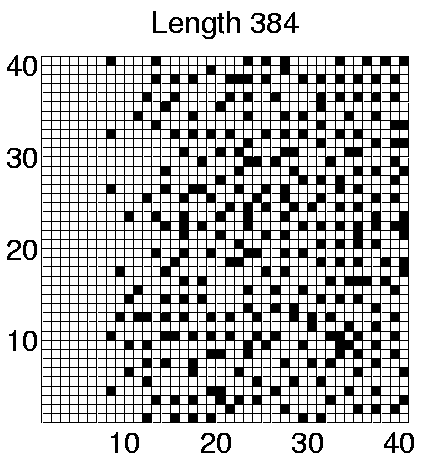
The spatial distributions of programs in the two Class 2 runs which showed some differentiation in program lengths (Runs 5 and 7) are shown in Figures 6.24 and 6.25. These figures clearly show that programs of different lengths are generally located in different regions of the environment. The segregation is not straightforwardly related to program length itself, as in Run 5 the smaller programs are further to the right of the grid, whereas in Run 7 the opposite is true. Similarly, a comparison of the individual genotypes reveals that the segregation is also not straightforwardly related to the number of et_collect instructions that a program contains. In fact, comparison of the genotypes reveals that the only consistent difference between programs living in different areas is that those dwelling exclusively in the right half of the grid (i.e. programs of length 372 in both runs) retain the ability to move, where those living further towards the left of the grid are sessile.
 |
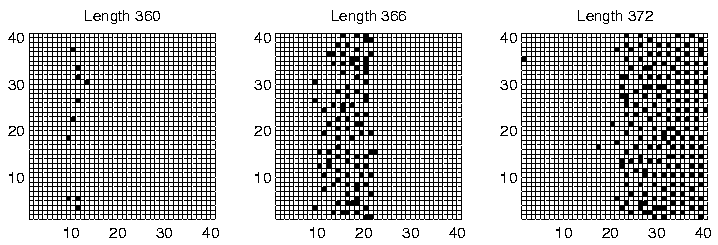 |
Considering the fact that a quarter of the grid does not contain sufficient energy for programs to survive for long, being able to move (and potentially wander into this area) might not seem like a particularly advantageous capacity for the programs to retain. However, analysis of the programs' movements reveals that they have a very strong preference for moving upwards (Direction 4 in Figure 4.3(a)). In comparison, the number of programs that move in any other direction is negligible. Remembering that the environment wraps around in both directions in these experiments (i.e. it is really toroidal in shape), these programs can therefore move around in this manner, while always remaining in the right half of the grid. Figure 6.20 shows that the number of programs of length 372 is fairly high towards the end of Runs 5 and 7, so the right half of the grid is fairly crowded. (This is not so clear in Figures 6.24 and 6.25, because these do not distinguish grid positions occupied by more than one program from those occupied by a single program.) In this situation, it is conceivable that a program might do better on average by moving around, rather than risk being stuck at a location where it is competing for energy with one or more other programs.
In contrast, programs that live in the left half of the grid in these runs were sessile. Grid positions in this half typically have much less available energy than those in the other half (Figure 6.23). The number of programs in this area is also much lower than in the other half (compare the number of programs of different lengths towards the end of Runs 5 and 7 in Figure 6.20 with the position of these programs in Figures 6.24 and 6.25). Under such conditions, these programs have adopted the strategy of staking a claim on a particular grid position. The concentration of programs in this area is low enough that they generally do not have directly neighbouring programs with which to compete for energy.
As a final point about these programs, notice that in Run 5, some of the sessile programs of lengths 378 and 384 are located in the right half of the grid, in competition with the motile programs of length 372. This suggests that the adaptive significance of movement in comparison to non-movement is not particularly great even in this half of the grid. The segregation of the different populations of programs has presumably been sustained by the existence of the energy gradient, but the initial appearance of the differences may have been due to rather contingent factors (`historical accidents'). This is supported by analysis of the programs in Runs 3 and 8, where no differentiation was seen. In Run 3, all of the programs were motile, and in Run 8 they were all sessile, despite the fact that in both runs the populations covered the full three-quarters of the environment (Figures 6.21 and 6.22).
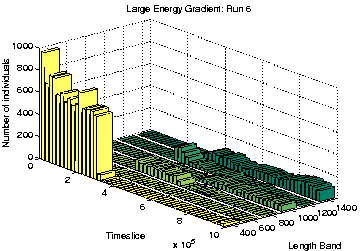
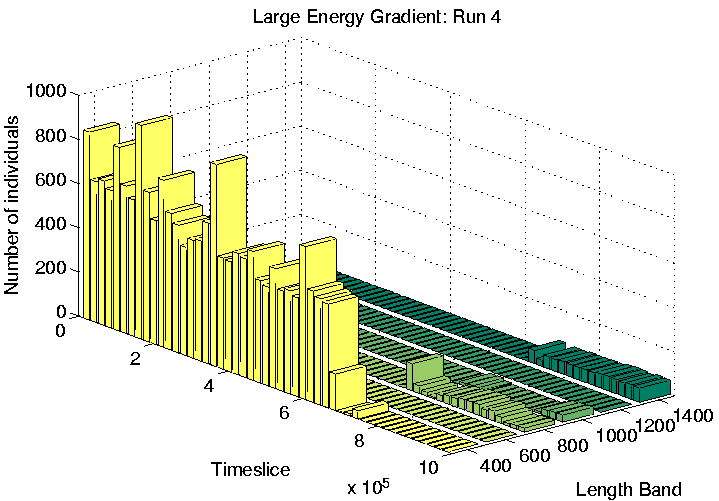
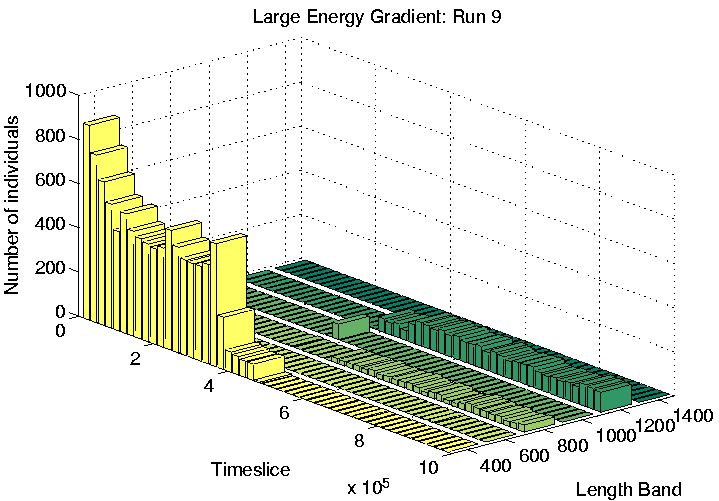
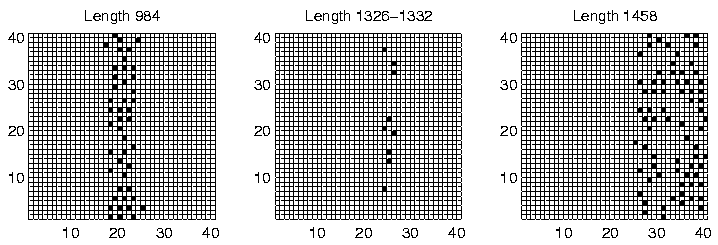
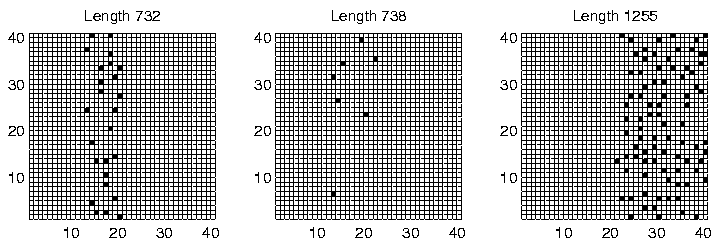
Finally, the three runs which display Class 1-like dynamics (numbers 4, 6 and 9) were analysed. All three of these showed length differentiation by the end of the run, as shown in Figure 6.26. As is typical for Class 1 runs, the lengths of programs were much longer than in Class 2 runs. The difference in length between the longest and shortest species in these runs was also much larger than in the differentiated Class 2 runs we have seen already (Runs 5 and 7). Note that the overall population sizes towards the end of these runs are also considerably smaller than in the Class 2 runs, especially in Runs 4 and 9 (Figure 6.26).
|
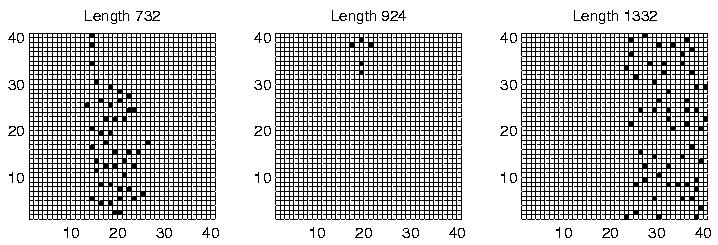
The spatial distribution of programs of the dominant lengths at time slice 900,000 is shown for each of the three runs in Figures 6.27-6.29. Again, programs of different length are clearly generally located in different areas of the environment, for all three runs. However, analysis of the individual genotypes revealed that this time the segregation was not related to the ability or inability of programs to move; in Run 6, all programs were sessile, and in Runs 4 and 9, all programs were motile, with a strong preference for moving upwards (Direction 4), or occasionally downwards (Direction 0). It appears that in these runs, the segregation was mainly due to the lengths of the programs. Grid positions in the area immediately to the left of the centre of the environment receive approximately 30 energy tokens at each pass through the control loop (Figure 6.23). This is the same amount that all positions normally receive under the standard parameter settings, and under those conditions (i.e. in most of the other experiments reported in this chapter) we have seen that the lengths of Class 1 programs are generally in the range 600-1200 bits. In the present runs, we see that programs in this central region also have lengths in that range (Figures 6.27-6.29). In contrast, programs to the right of the environment are of greater length (typically 1250-1500 bits). Remembering that longer programs are allowed to execute more instructions per time slice, and therefore are potentially able to collect more energy per time slice, the location of these programs can be explained by the larger amounts of energy typically available in the right half of the environment.
|
|
 |