next up previous contents
Next: Energy Up: The CPU-time Distribution Scheme Previous: The CPU-time Distribution Scheme

Results

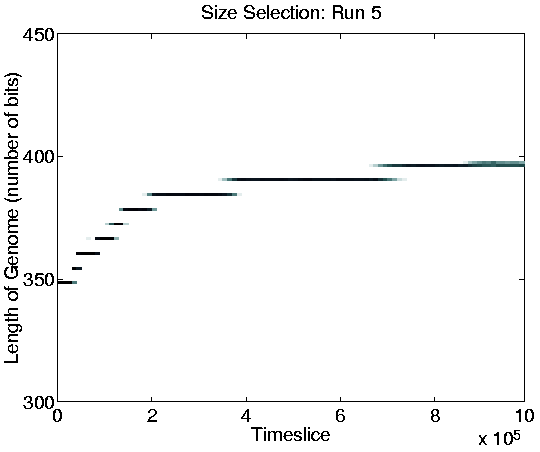
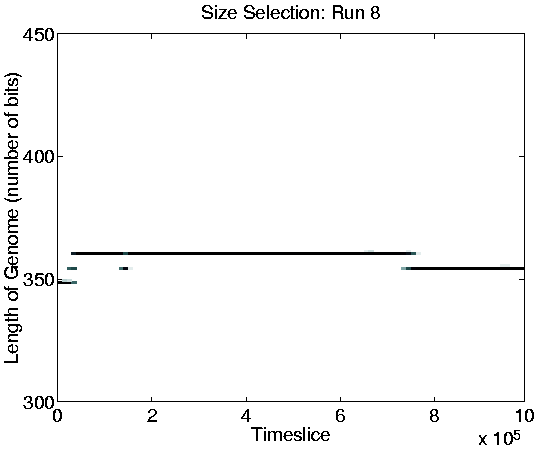
All nine runs showed Class 2 dynamics for their whole duration. This therefore confirms the prediction made in Section 6.2.1 that Class 1 dynamics would not arise if longer programs had no advantage in terms of the number of instructions they were allowed to execute per time slice.

In each of the nine runs, the program length (and the replication period) of the programs still showed a net increase from the beginning to the end of the run, but the increments were fairly gradual. The smallest end-of-run dominant program length seen in any of the runs was 354 (Run 8), the largest was 402 (Run 1), and the average was 375. Plots of program length from four of the runs are shown in Figure 6.16. Analysis of individual programs revealed that the increase in size was due largely to the accumulation of energy collection instructions within the programs' copy loops.


Figure 6.16: CPU-time Distribution: Graphs of Program Length for 4 of the 9 Runs.

\resizebox{0.75\linewidth}{!}{\includegraphics{graphs/sizeselection/lengthSizeSel3.shrunk.ps}}


\resizebox{0.75\linewidth}{!}{\includegraphics{graphs/sizeselection/lengthSizeSel5.shrunk.ps}}


\resizebox{0.75\linewidth}{!}{\includegraphics{graphs/sizeselection/lengthSizeSel8.shrunk.ps}}


\resizebox{0.75\linewidth}{!}{\includegraphics{graphs/sizeselection/lengthSizeSel9.shrunk.ps}}


next up previous contents
Next: Energy Up: The CPU-time Distribution Scheme Previous: The CPU-time Distribution Scheme
Tim Taylor
1999-05-29