next up previous contents
Next: Procedure: Randomisation Version of Up: The Role of Chance.2 Previous: Method

Results

For each measure, the results from each of the 19 runs were compared.6.5 Some of the measures (Population Size, Age at Death, Flaw Period, Number of Faithful Replications and Number of Unfaithful Replications) generally showed no trends, and their absolute values were very similar across different runs. In contrast, trends were observed in the five other measures (i.e. Cumulative Activity, Mean Cumulative Activity, Diversity, Program Length and Program Replication Period), with noticeable differences between some of the runs. Plots for some of these measures are presented for two example runs (10 and 17) in Figure 6.1.


Figure 6.1: Contingency Experiments. Graphs of Cumulative Activity, Mean Cumulative Activity, Diversity, Program Length and Replication Period for Runs 10 (left) and 17 (right).

\rotatebox{270}{
\resizebox{!}{0.62\linewidth}{\includegraphics{graphs/alife6/activity_c10.ps}}}


\rotatebox{270}{
\resizebox{!}{0.62\linewidth}{\includegraphics{graphs/alife6/activity_c17.ps}}}


\rotatebox{270}{
\resizebox{!}{0.62\linewidth}{\includegraphics{graphs/alife6/mean_activity_c10.ps}}}


\rotatebox{270}{
\resizebox{!}{0.62\linewidth}{\includegraphics{graphs/alife6/mean_activity_c17.ps}}}


\rotatebox{270}{
\resizebox{!}{0.62\linewidth}{\includegraphics{graphs/alife6/diversity10.ps}}}


\rotatebox{270}{
\resizebox{!}{0.62\linewidth}{\includegraphics{graphs/alife6/diversity17.ps}}}


\resizebox{0.62\linewidth}{!}{\includegraphics{graphs/alife6/me13.length10.shrunk.ps}}


\resizebox{0.62\linewidth}{!}{\includegraphics{graphs/alife6/me13.length17.shrunk.ps}}


\resizebox{0.62\linewidth}{!}{\includegraphics{graphs/alife6/me13.reprate10.shrunk.ps}}


\resizebox{0.62\linewidth}{!}{\includegraphics{graphs/alife6/me13.reprate17.shrunk.ps}}


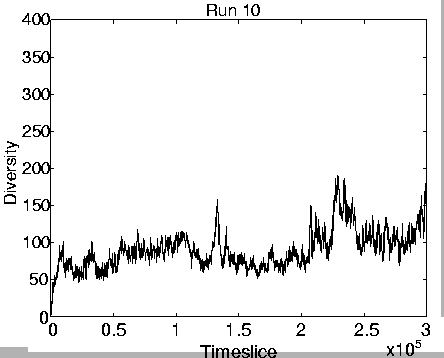
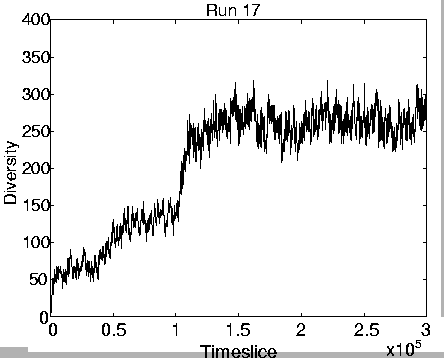
Ideally, we would like to know whether the differences in these measures between any of the runs are statistically significant. Such differences would indicate that evolution might genuinely be treading a different path, for no other reason than the different seed used for the random number generator when the runs commenced. The choice of a statistical test for this task was not immediately obvious. We wished to avoid parametric tests, as we did not want to make assumptions about the population parameters (for example, there is no reason to suspect that any of the measures we are looking at are normally distributed across all possible evolutionary runs).

We therefore chose a non-parametric method--a randomisation version of the paired sample t test (described in [Cohen 95]). For each measure of interest, this test will tell us, for each run, which other runs produced significantly different results. The test can indicate whether two samples are related without any reference to population parameters. The procedure used was as follows:


next up previous contents
Next: Procedure: Randomisation Version of Up: The Role of Chance.2 Previous: Method
Tim Taylor
1999-05-29